Know your price before you enter
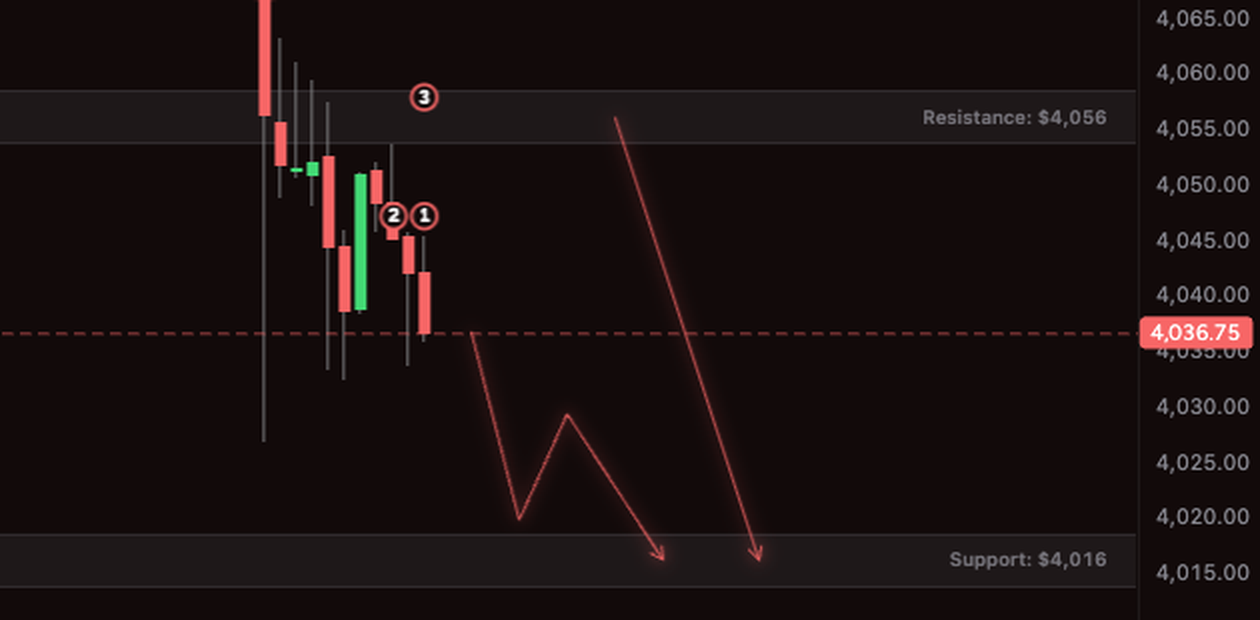
The chart marks the prices where a trade makes sense. Shown on a real day: US CPI, Tuesday, November 10.
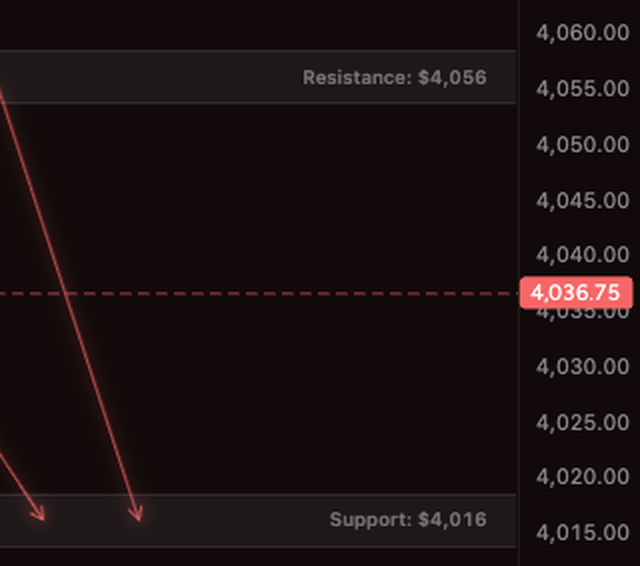
The bands are where price often turns
- 1. Support, the band under price: 4,016
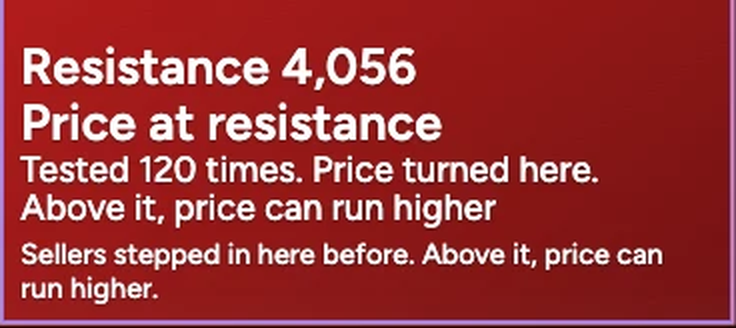
- 2. Resistance, the band over price: 4,056
- A band stays on the chart until a candle closes through it
 1
2
 1
2
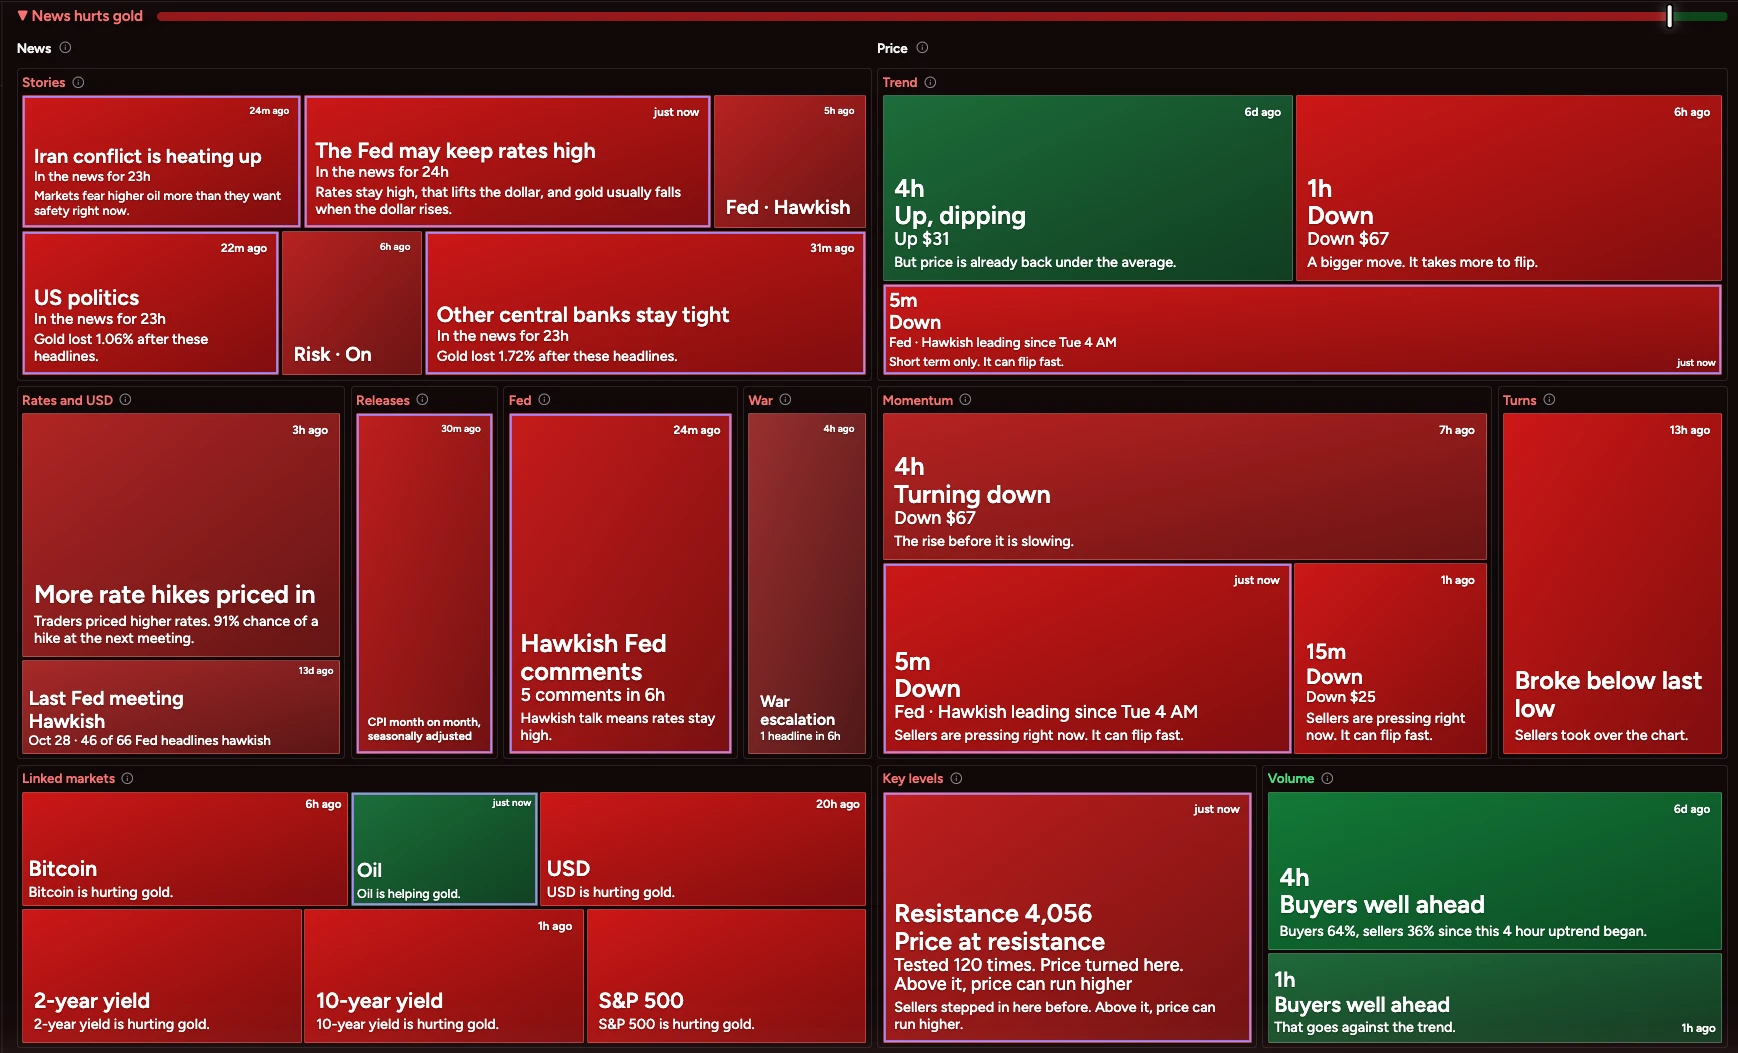
Enter where the news and the level agree
- News hurts your market and price is at resistance: look to sell
- News helps your market and price is at support: look to buy
- 1. After CPI, the bar read News hurts gold
- 2. The Key levels box read Price at resistance, 4,056
 2
 1
 2